THE STORY BEHIND THE NUMBERS
Your manager/peers want to you to tell them any insights from the daily/weekly/monthly data the story behind the numbers: how many page views/visits/visitors we generated/reached, how users engaged with the content of the site, is there anything that attracted them, what make them stay longer, what they bought ….
Here few easy steps to be followed
Regardless who the receivers are (clients, managers, peers …) start always with a short presentation of how the site performed using a simple eye catching table:

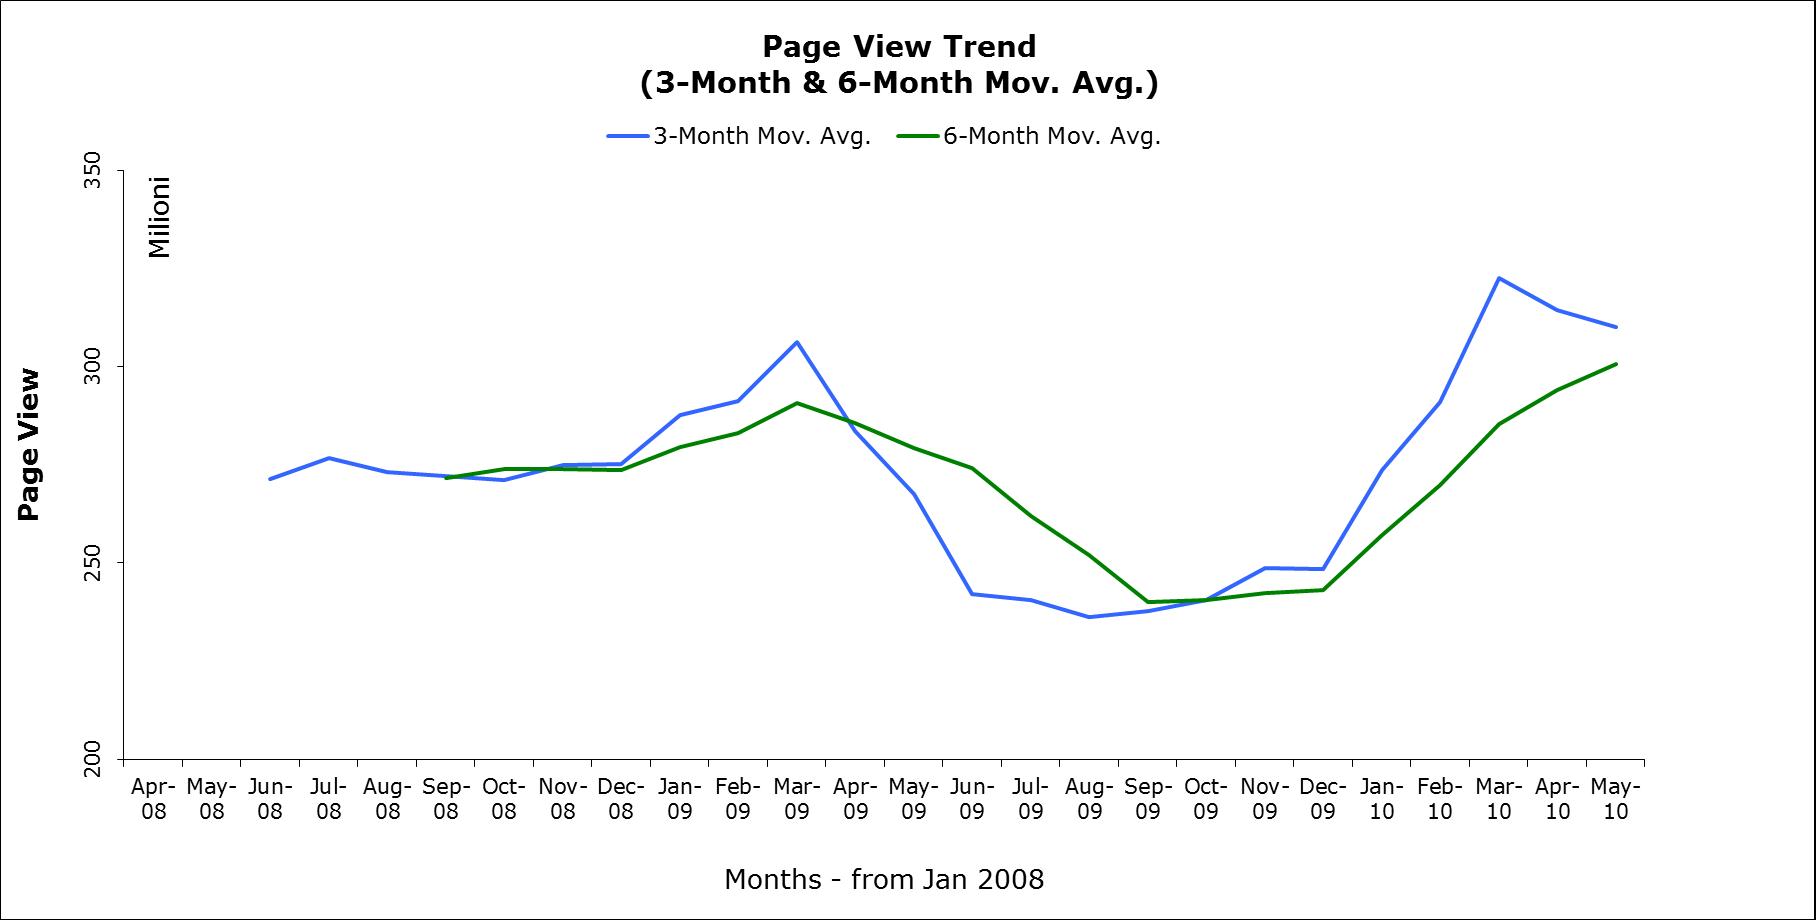
The most important variables you need to look at are the % change from the short/medium rolling average and from target. The formers because they are an indication of the trend – if the shorter is up the longer the data are on upside trend and vice versa – the latter because it tells you how far the performance is from its goal.
As rolling short/medium rolling average you should use the 4-week and 12-week rolling average for your weekly report, and the 3-month and 6-month rolling average for your monthly report.

You need to report variations from of the actuals vs. the rolling figures when:
- The shorter moving average crosses above the longer moving average. This is also known as a golden cross or bullish crossover.
- The shorter moving average crosses below the longer moving average. This is known as a dead cross or a bearish crossover.
The taking place of the former (latter) event implies the starting of an upward (downside) trend. You can use the below graph to show clearly how far the actuals performances are from the goals. You can eventually use the Sensitivity Analysis tool in Excel (Solver) to show the range of values the objective function coefficients can assume without changing the optimal solution (so affecting the reaching a determined target).

The %change y-on-y is useful to spot whether any changes might be seasonal related, the performances are in countertendency or not…
Questions you need to ask yourself are: 1) are we following a similar path y-on-y? (You need to compare the slope of the 2 trending lines and check whether the newest is narrower or deeper than the oldest). 2) If there is a change, was this an event related (e.g. a big promotion, or World Championship tournament), system related (e.g. connection issues, crash, loss of data), or brand related? 3) How are we compared to competitors/industry benchmark? comScore, Hitwise and Nielsen NetRating might help you comparing your company’s stats with competitors.
2) USER JOURNEY ANALYSIS
Typical questions you need to find an answer in your data:
- HOW USERS ENTERED YOUR SITE (For Search Engine analysis see below)
Firstly, look at figures as Entry Visits total and by products, were there any significant changes? Can you explain what did happen? E.g. promotions, email marketing, viral marketing, referrals…

Looking at the top prod per %change w-on-w on entry visits; were there a specific/page section that attracted your visitors? Can you explain the reason? How many users did leave the site after viewing just one content area (bounce rate)? How many go through the first step and went deep into your site?
If your package allows you to do so, it will be good to list periodically which section of the site has a higher depth ratio (or how many page views per entry visits are made by products). This ratio helps you identifying the stickier areas of your site.
- HOMEPAGE JOURNEY
Most of your users will probably start their journey from your homepage. So it is worth having a look at how it performed. If your analytics package allows you, build up an HP report based on clicks (it is also helpful for MVT testing and SEO Optimization) and divide your site by functions (navigational, commercial, search, content, product areas).
Again, you can use the Sensitivity Analysis tool in Excel to determine the range of values your KPIs are allowed to move in between for reaching your medium term goal. In addition, the Shadow Price will help you understand the level of correlation between each variable.
Questions you need to ask yourself: How many users leave the site after just entering your HP? Why? Is there a specific area your users are more likely to click trough? For reaching a second level content area, which tools are they using: navigation toolbars, site maps, content area? Are there any features in your HP that can cause a high level of bounce rate? E.g. Adverts, Google Search Box, external links …
Are they correlated? How much?
It is important to monitor how many visits to the HP end with a search, or a click on an advert: whilst you gaining revenues from the latter, if your site is not performing consistently in the former will be difficult for you to attract ad revenues.
Periodically, look at how your users are behaving during a week using pivot tables and report any variation and investigate the reason behind it.
- USERS SEGMENTATION USING WEB ANALYTICS
You need to segment your users according to their activities. Take into consideration a scenario in which you have:
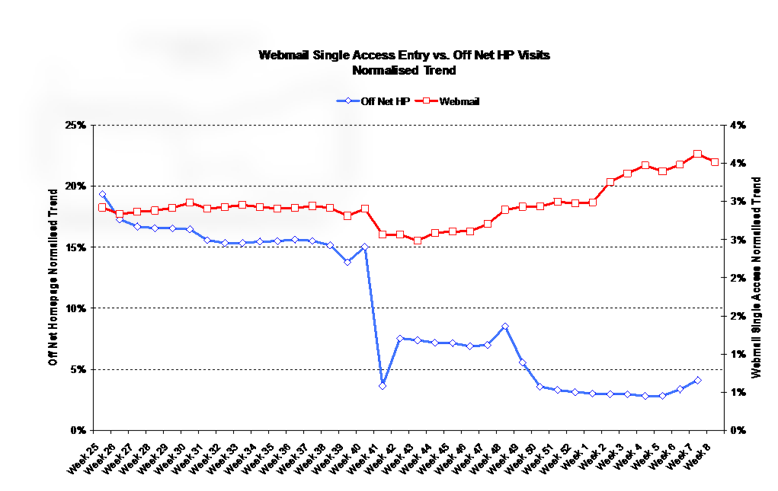
a) Website offering webmail/members Services. Users only interested in checking their own email/members page. They might follow one of the following users’ journey: i) bookmarked their webmail address and visit only their mail box; ii) landing to their webmail box after visiting the HP; iii) using Outlook, or Eudora …
This is how you can build up those KPIs: 1) Entry Content: visits from everyone accessing your site via the Webmail (as entry content); 2) Single Access Content: a restriction from the above definition – we are taking into account solely those interest in checking their email, and thus not generating any page views passed the webmail; 3) Traffic Beyond Webmail: all visits of those accessing the site via Webmail who are also generating page views beyond it.
The business goal might be to increase either their time spent on site after checking their mail box, the page views generated after (so they need to visit at least another content area) or both. As an analyst you need to monitor those KPIs over a period of time to highlight any changes in trend:

b) Websites offering Search Services: Users interested in using the Search Box: their journey might include those who: i) bookmarked the search page as their entry page; II) entered the site via the HP and subsequently use the Search Box; III) conducting a search after visiting the site.
This is how you can build this metrics: 1) Direct Search: all paths made by users that are using your site with the sole intention of conduction a search, being the HP their entry point and the Search page their subsequent exit page; 2) Effective Search: all paths ending successfully with a click over either an organic or sponsored link published on the Search Page; 3) Total Search: all paths that include a visit over a Search Page but that do not necessary end with an exit.

c) Websites offering eCommerce offers: Users only interested in buying/upgrading their broadband package (see the funnel section).
d) Engagement Metrics: Users who engaged with the content (I’ll write another post for those). Thus, looking at those who watch videos, read articles, leave comments, subscribe to newsletters, forward a page to a friend/SN …
- ENTRY FEATURES/TOOLS
As in point 2, but instead of looking at each product areas performed better in attracting external users, here you look at features as blog comments, videos, update posts that can affect your positioning in the SE, social networking sites…
- SEARCH ENGINES
How is your site positioned in the web? How many visitors are coming from SE? If you have a login to Hitwise, look at keywords and key-phrases your visitors are more likely to use. Higher entries made by users who bookmarked your site URL into the browsers means high brand awareness, nonetheless you also need to monitor new visitors’ trend to avoid the trap of being stalled into the mature product cycle curve. If entry visits to your site from SE are on downside trend, check whether your site is properly optimized for Google/Bing/Yahoo. From the above HP analysis, where you able to identify areas that are less likely to be clicked? A “user friendlier” HP is more likely to be also better optimized.
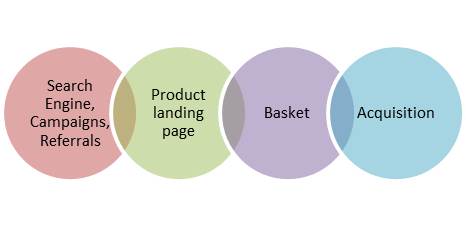
- FUNNEL OR SCENARIO ANALYSIS
Regardless the business nature of your site, specific sections need to be analyzed using funnels or custom reports. To have a better understanding of the market drivers, you need to make sure your software allow you to track the sources of your sales cycle: campaign, SE, referrals, HP …
Ideal scenarios (one for each referral):

Is there any drop out? Check always whether a potential crash in the system might explain the drop out that occurs at the basket level. Sorry, cannot show data.
7) EXIT
A tricky one. Google won’t allow you to check where your visitors are going after viewing your site. Still, you can monitor KPIs as: number of users who click on adverts, search, click on Facebook/Twitter/… icon in your site … and use comScore and Hitwise stats.
Hope you enjoy it.
